All 15 results
Sort by
-
Drawing_Maps_VisualAnalytics_Week14_NEC_Solved
- Exam (elaborations) • 11 pages • 2023
- R199,98
- 2x sold
- + learn more
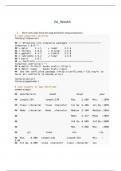
1. pipe the election data through the select() function to pick out the following columns - state, total_vote, r_points, pct_trump, party, census. Pipe that through sample() to see the first five rows. 2. Create a state level dotplot of election data except the District of Columbia faceted by region. Colorize the dots by party and insert a vertical line dividing the parties, scale the x axis from -30 to +40, put the states on the y axis and label each facet by region and the entire set by "Poi...
-
Working_with_Models_VisualAnalytics_Week9_NEC_Solved
- Exam (elaborations) • 8 pages • 2023
- R199,98
- 1x sold
- + learn more
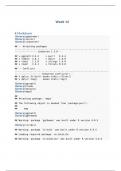
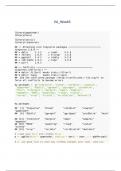
1. Using the gapminder data, create a plot comparing log(gdp PerCa with Life Exp and show three different smoothers in three different colors with a legend showing each smoother type. 2. In a paragraph compare and contrast the smoother types. LOESS, Cubic Spline, and OLS 3. Look at the gapminder data with str() 4. Create a linear model of the gapminder data with life expectancy as the target of a multifactor model built from gdpPercap, pop, and continent. Store it in a variable called ...
-
Drawing_Maps_VisualAnalytics_Week13_NEC_Solved
- Exam (elaborations) • 11 pages • 2023
- R199,98
- 1x sold
- + learn more
1. pipe the election data through the select() function to pick out the following columns - state, total_vote, r_points, pct_trump, party, census. Pipe that through sample() to see the first five rows. 2. Create a state level dotplot of election data except the District of Columbia faceted by region. Colorize the dots by party and insert a vertical line dividing the parties, scale the x axis from -30 to +40, put the states on the y axis and label each facet by region and the entire set by ...
-
Building_Layered_Visualizations_VisualAnalytics_Week6_NEC_Solved
- Exam (elaborations) • 16 pages • 2023
- R199,98
- + learn more
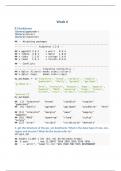
1. get the structure of the gss_sm dataframe. What is the data type of race, sex, region and income? What do the levels refer to? 2. create a graph that shows a count of religious preferences grouped by region 3. turn the region counts in percentages 4. use dodge2() to put the religious affiliations side by side within regions 5. show the religious preferences by region, faceted version with the coordinate system swapped 6. using pipes show a 10 random instances of the first six columns in...
-
Plotting_Text_VisualAnalytics_Week7_NEC_Solved
- Exam (elaborations) • 10 pages • 2023
- R199,98
- + learn more
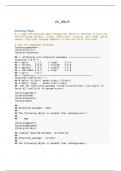
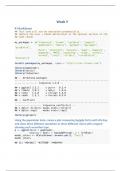
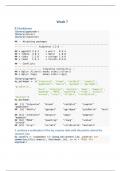
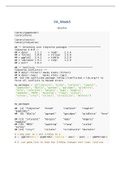
1. produce a scatterplot of the by_country data with the points colored by consent_law 2. Using facet_wrap() split the consent_law variable into two panels and rank the countries by donation rate within the panels 3. Use geom_pointrange() to create a dot and whisker plot showing the mean of donors and a confidence interval. 4. Create a scatterplot of roads_mean v. donors_mean with the labels identifying the country sitting to the right or left of the point 5. load the ggrepel() library 6. ...

As you read this, a fellow student has made another R85

-
Visual_Analytics_NEC_All_Weeks_Solved_Week3_to_Week15_Solutions
- Package deal • 13 items • 2023
- R2.392,38
- + learn more
Visual Analytics All weeks solved from week 3 to week 15. Read the week description and access the right document for that week. Report any errors found and they will be fixed accordingly. Don't share the document, instead share the link to this advertisement.
-
Visual_Analytics_Week3_Solved
- Exam (elaborations) • 9 pages • 2023
- R199,98
- + learn more
Follow the instructions in the book to create a new project. Give it a name and an author. Execute the 3 code snippets from the preface to bring all the packages into this new project then create a new R Markdown document as instructed by the book. Load the tidyverse and socviz libaries. In order to execute code in an R Markdown object, the code must be enclosed by: ```{r}.....``` Use R studio to complete the following: 1. create a vector of the names of the members of your immediate family ...
-
Refining_your_Graphs_VisualAnalytics_Week14_NEC_Solved
- Exam (elaborations) • 6 pages • 2023
- R199,98
- + learn more
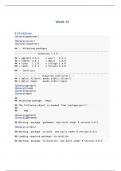
1. look at the first six rows of the asasec dataset 2. plot members v revenue for 2014 in a scatterplot with a confidence interval 3. switch from loess to ols and add the Journal variable 4. show the first six rows of studebt 5. create a faceted comparison of the two distributions - percent of all borrowers and Percent of all balances to show how student loan debt is distributed. 6. Compare this pair of graphs to the pie charts in figure 8.24 Which visualization do you find it easier to ma...
-
Plotting_Visual_Analytics_Week4_NEC_Solved
- Exam (elaborations) • 19 pages • 2023
- R199,98
- + learn more
1. Show meta data from the mpg dataframe using summary(). 2. Show metadata from the gapminder dataframe 3. assign ggplot(data = gapminder, mapping = aes(x = gdpPercap, y = lifeExp) to the variable 'p' 4. find the structure of the p object. 5. add () to the p object. Show p. 6. replace () with h(). Show p. 7. return to and add h(). Show p. 8. add the linear element to the h function. Show p. 9. change the x axis scare to log10. Show p. 10. try scale_y_log10(). Show p. 11. change the...
-
Showing_the_Right_Numbers_VisualAnalytics_Week5_NEC_Solved
- Exam (elaborations) • 27 pages • 2023
- R199,98
- + learn more
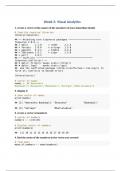
According to the author, 'ggplot is an implementation of the grammar of graphics' which is a set of rules for producing visualizations of data. In this first plot, we will track the trajectory of life expectancy over time for each country in the data. 1. map year to x and lifeExp to y. 2. use geom_line to show how lifeExp changes over time. (did you notice a mistaken assignment to the y parameter in the book?) 3. use grouping to make each line refer to a specific country in the...
